

Trade Plan: ES/SPY/SPX + NQ /QQQ 09/11/2023
Trade Plan: ES/SPY/SPX + NQ /QQQ 09/11/2023

In response to the expressed desire for Sierra Charts studies to be accessible on the move and in a mobile-friendly format, I've devoted some time to this initiative. I'm excited to inform you that I have been actively coding the Balance Studies on TradingView. The day is approaching when this feature will be live for those who utilize Sierra Charts. Recognizing that not everyone might have the capability or preference to use Sierra, they can, however, leverage TradingView, which will subsequently grant them access to Sierra. Thus, giving users the flexibility to utilize both platforms or choose one that aligns with their preferences.
In the ever-evolving world of stock indexes, both the ES and NQ are revealing noteworthy patterns. Centered around the pivotal 12B level, the ES, in particular, is displaying hints of a potential shift. With the possibility of some sideways or even downward movement in the upcoming days, traders should be vigilant. The NQ, while echoing similar sentiments, demands its own set of strategies based on its unique fluctuations. A corrective surge in either market could present the most auspicious setup for traders, setting the stage for a deeper bear trend that might eclipse the lows witnessed in August. With these insights, let's now delve into the trade plans for each market.📉📊🔍

Trade Plan for ES (E-mini S&P 500 Futures):
Initial Observations:
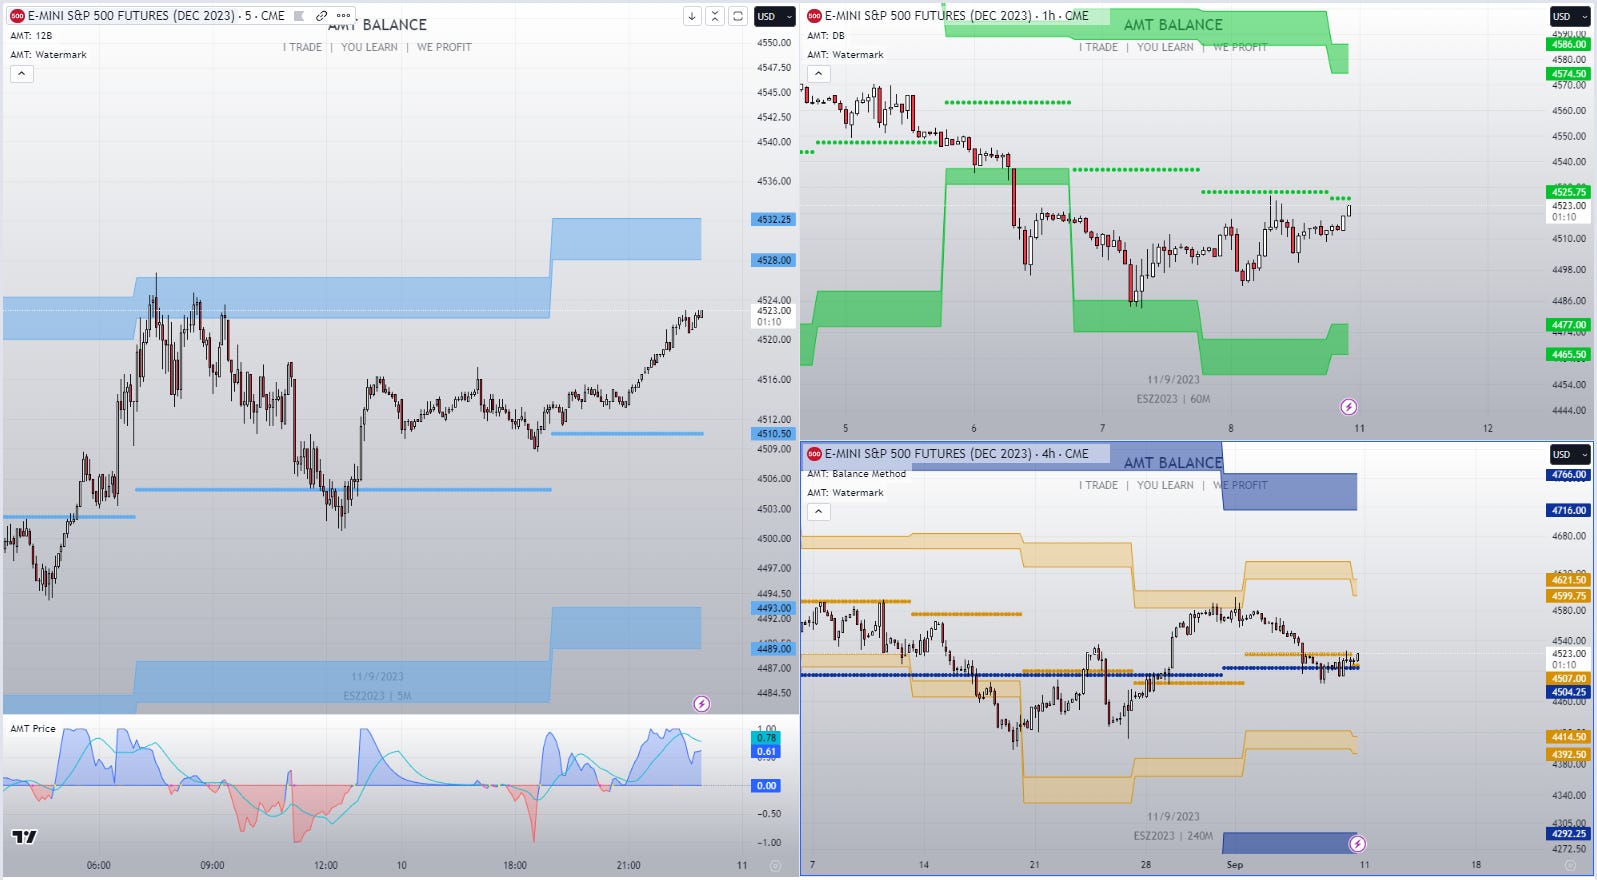
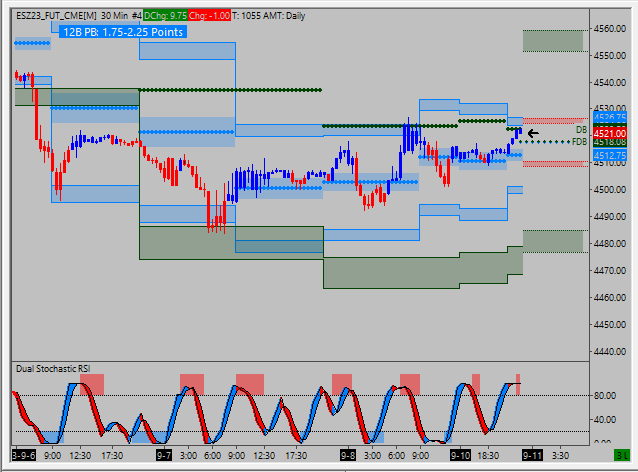
12B Price: 4512.75
Daily Balance (DB) Level: 4522.5
Weekly Balance (WB) Level: 4507.75
Trade Scenarios:
a. Buying Opportunity:
If the RTH open or consistent bids remain above the 12B level of 4512.75, bullish momentum is projected:
The initial target becomes the Upper Dyno of 12B, situated between 4524.25 and 4527.
Breaching the 12B's Upper Dyno, the Daily Balance's Upper Dyno comes into focus, ranging from 4565.75 to 4576.
If the bullish trend persists, the Weekly Balance of 4507.75 could serve as a retracement point, with its Upper Dyno spanning from 4599 to 4620.5.
b. Selling Opportunity:
Should the RTH open or offers consistently reside below 4512.75, a bearish trajectory is anticipated:
The first point of interest would be the Lower Dyno of 12B, between 4498.75 and 4501.5.
A pronounced bearish move would target the Lower Dyno of the Daily Balance, which stretches from 4469.25 to 4479.25.
In a more extended bearish scenario, the Lower Dyno of the WB, ranging from 4395 to 4416.5, becomes a primary target.
c. Dyno Reclaim Scenarios:
When navigating within the Dyno zones:
A quick dip into a Lower Dyno that's swiftly reclaimed by buyers suggests potential long positions, targeting the nearest balance or level.
Conversely, a rapid ascent into an Upper Dyno quickly negated by sellers points to potential short trades, aiming for the subsequent balance or level.
Charts & Custom Studies for Sierra Chart users: MONTHLY

Trade Plan for NQ (E-mini NASDAQ-100 Futures):
Initial Observations:
12B Price: 15509
Daily Balance (DB) Level: 15550.75
Weekly Balance (WB) Level: 15422.75
Trade Scenarios:
a. Buying Opportunity:
When the RTH open or consistent bids are above the 12B level of 15509, an upward momentum is anticipated:
The first target zone is the Upper Dyno of 12B, which is between 15563.5 and 15576.5.
Surpassing the 12B's Upper Dyno brings into view the Daily Balance's Upper Dyno, ranging from 15766.75 to 15817.75.
In a sustained bullish push, the Weekly Balance of 15422.75 might act as a retracement point, followed by its Upper Dyno that spans from 15893 to 16004.
b. Selling Opportunity:
If the RTH open or offers consistently stay below 15509, a bearish trajectory is in the offing:
The initial target in this scenario is the Lower Dyno of 12B, which lies between 15441.75 and 15454.5.
A more significant bearish move would bring the Lower Dyno of the Daily Balance into focus, ranging from 15283.5 to 15334.5.
In an extended bearish phase, the Lower Dyno of the WB, between 14841.25 and 14952.25, becomes a primary point of interest.
c. Dyno Reclaim Scenarios:
While moving within the Dyno zones:
A brief dip into a Lower Dyno that's promptly reclaimed by buyers indicates potential long trades, targeting the nearest balance or level.
In contrast, a quick rise into an Upper Dyno immediately countered by sellers points to potential short opportunities, targeting the subsequent balance or level.

Charts & Custom Studies for Sierra Chart users: MONTHLY
Disclosure
Analytical Market Theory LLC is not a registered entity and not a licensed financial professional and therefore is not qualified to give investment advice. Information presented through this application such as calculations, or other social media posts, discussions, information on the website, chatroom, podcast, or through email or any form of electronic communication is strictly our opinion and for educational purposes only. It is not to be taken as investment advice or an instruction to buy and sell any security or influence any investment decision. Trade at your own risk.
🛑DO NOT COPY MY TRADES. THIS IS FOR EDUCATION 🛑
CFTC - Hypothetical Performance Disclaimer
Hypothetical performance results have many inherent limitations, some of which are described below. No representation is being made that any account will or is likely to achieve profits or losses similar to those shown; in fact, there are frequently sharp differences between hypothetical performance results and the actual results subsequently achieved by any particular trading program. One of the limitations of hypothetical performance results is that they are generally prepared with the benefit of hindsight. In addition, hypothetical trading does not involve financial risk, and no hypothetical trading record can completely account for the impact of financial risk of actual trading. For example, the ability to withstand losses or to adhere to a particular trading program in spite of trading losses are material points which can also adversely affect actual trading results. There are numerous other factors related to the markets in general or to the implementation of any specific trading program which cannot be fully accounted for in the preparation of hypothetical performance results and all which can adversely affect trading results. FUTURES TRADING INVOLVES RISK. THERE IS A RISK OF LOSS IN FUTURES TRADING. PAST PERFORMANCE IS NOT NECESSARILY INDICATIVE OF FUTURE RESULTS